Please visit the COVID-19 response page for resources and advice on managing through the crisis today and beyond.
Please visit the COVID-19 response page for resources and advice on managing through the crisis today and beyond.
This guide takes you through our M-profit portfolio tracker and explains how you can use the tracker seamlessly and view/download multiple reports from the portfolio tracker.
Disclaimer: You may find discrepancies in your stock holdings due to some of the factors mentioned below. For further assistance or queries, you may contact your RM or our help desk at +91 8336069309Please proceed to https://cloud.mprofit.in// and enter your email ID and password (contact your RM to get your login credentials). You’ll be logged in to the portfolio tracker after entering the same.
Upon logging in, you will be able to see the “Family Group” section and UCC/portfolios mapped under it on the left-hand side. If you have more than one portfolio/UCC mapped, it will show as a list denoted by your UCC or the portfolio’s name (green rectangular box in the screenshot below).
UCC, client name, and other personal details have been redacted throughout this guide for privacy and security reasons.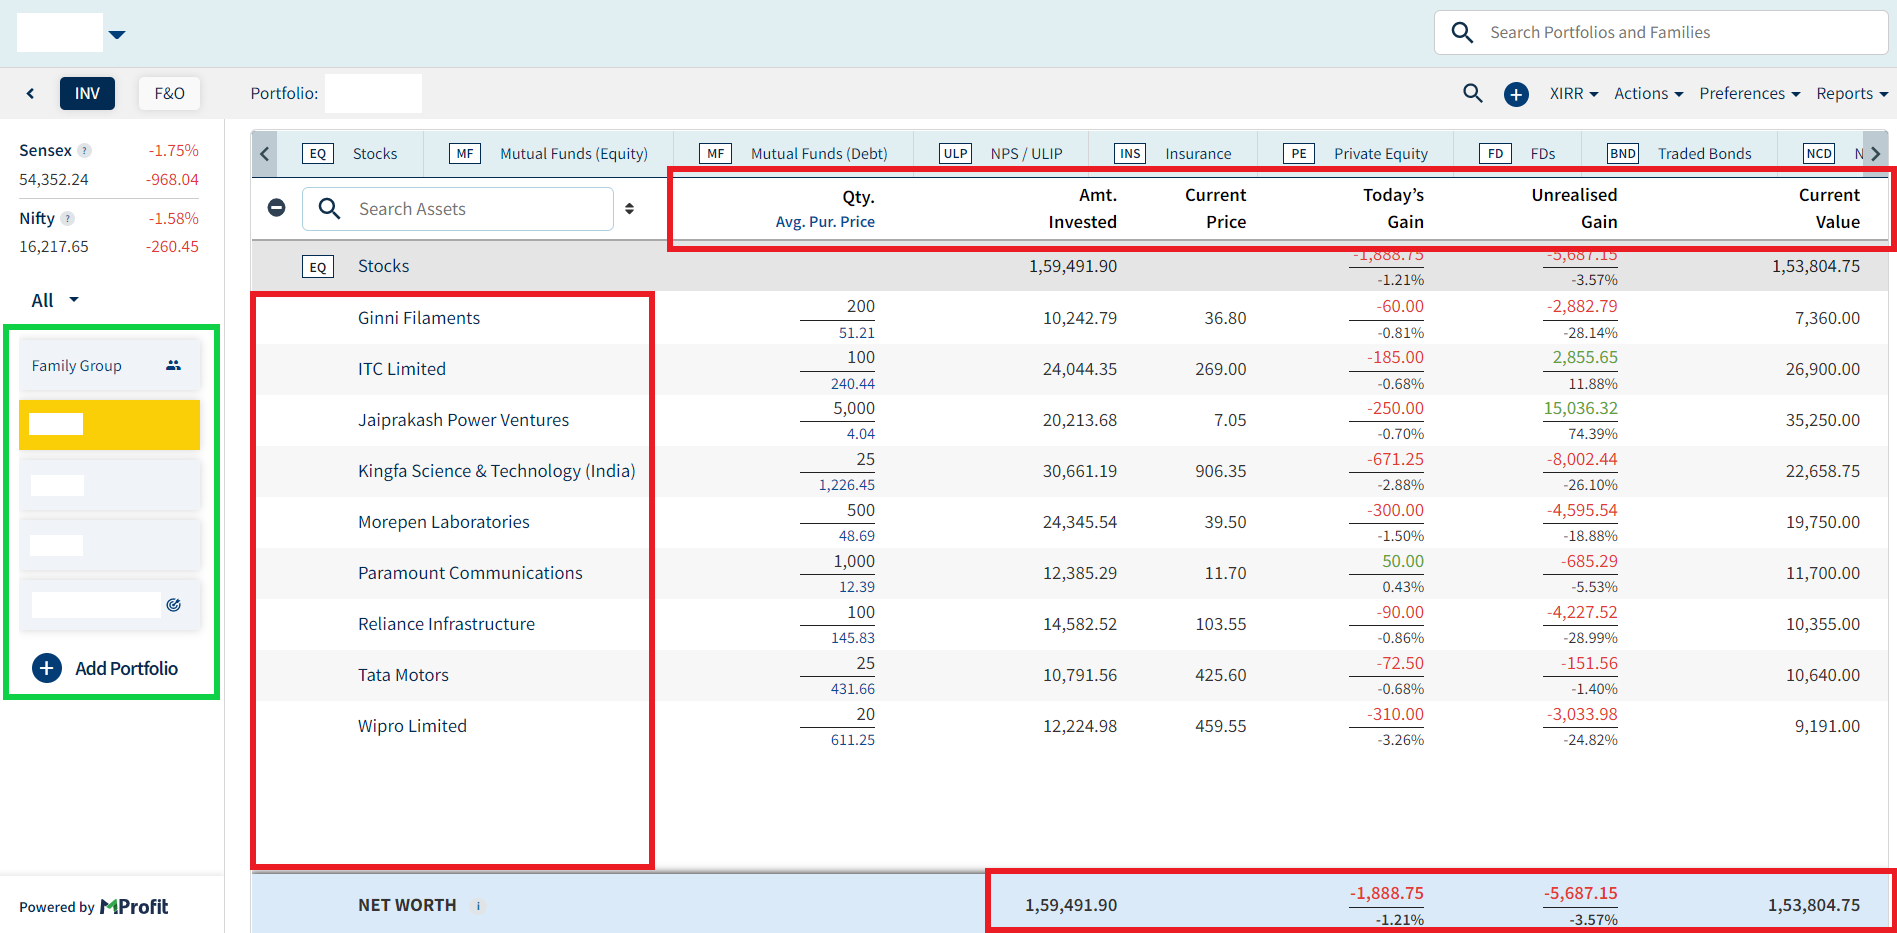
By clicking on any single UCC/Portfolio (Selected UCC/Portfolio will be highlighted in yellow), you’ll be able to see details specific to that UCC/Portfolio like securities, quantity, average purchase price, day’s gain/loss, unrealised gain/loss, and the current value of your holding (highlighted in red rectangularboxes above).The average purchase price of stock holdings is shown after adjusting for brokerage.
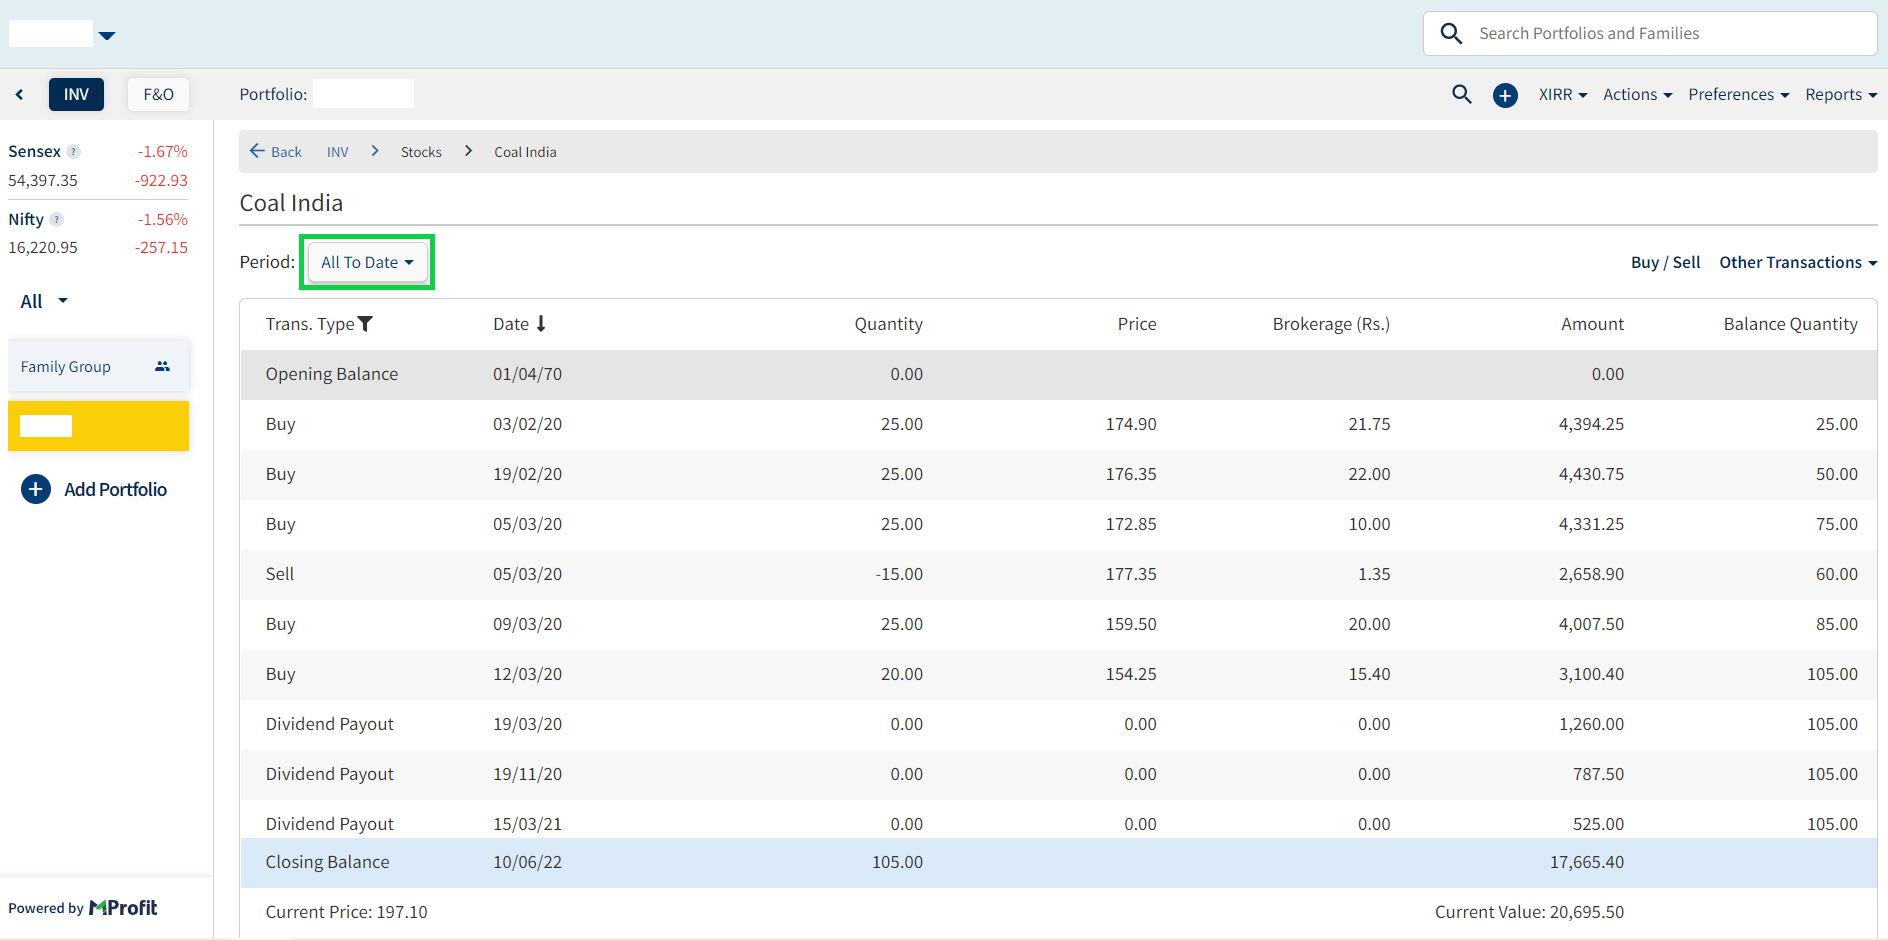
Additionally, you can click on particular security to view transactions, dividends received, and other corporate transactions about the stock(see below).
On the top-left, you will find a drop-down menu that allows you to select the periods for which you want to view the transactions (rectangular green box below). You can view transactions for a particular FY, last FY, current FY, for a specific month, or all transactions to date and also set up your custom range.
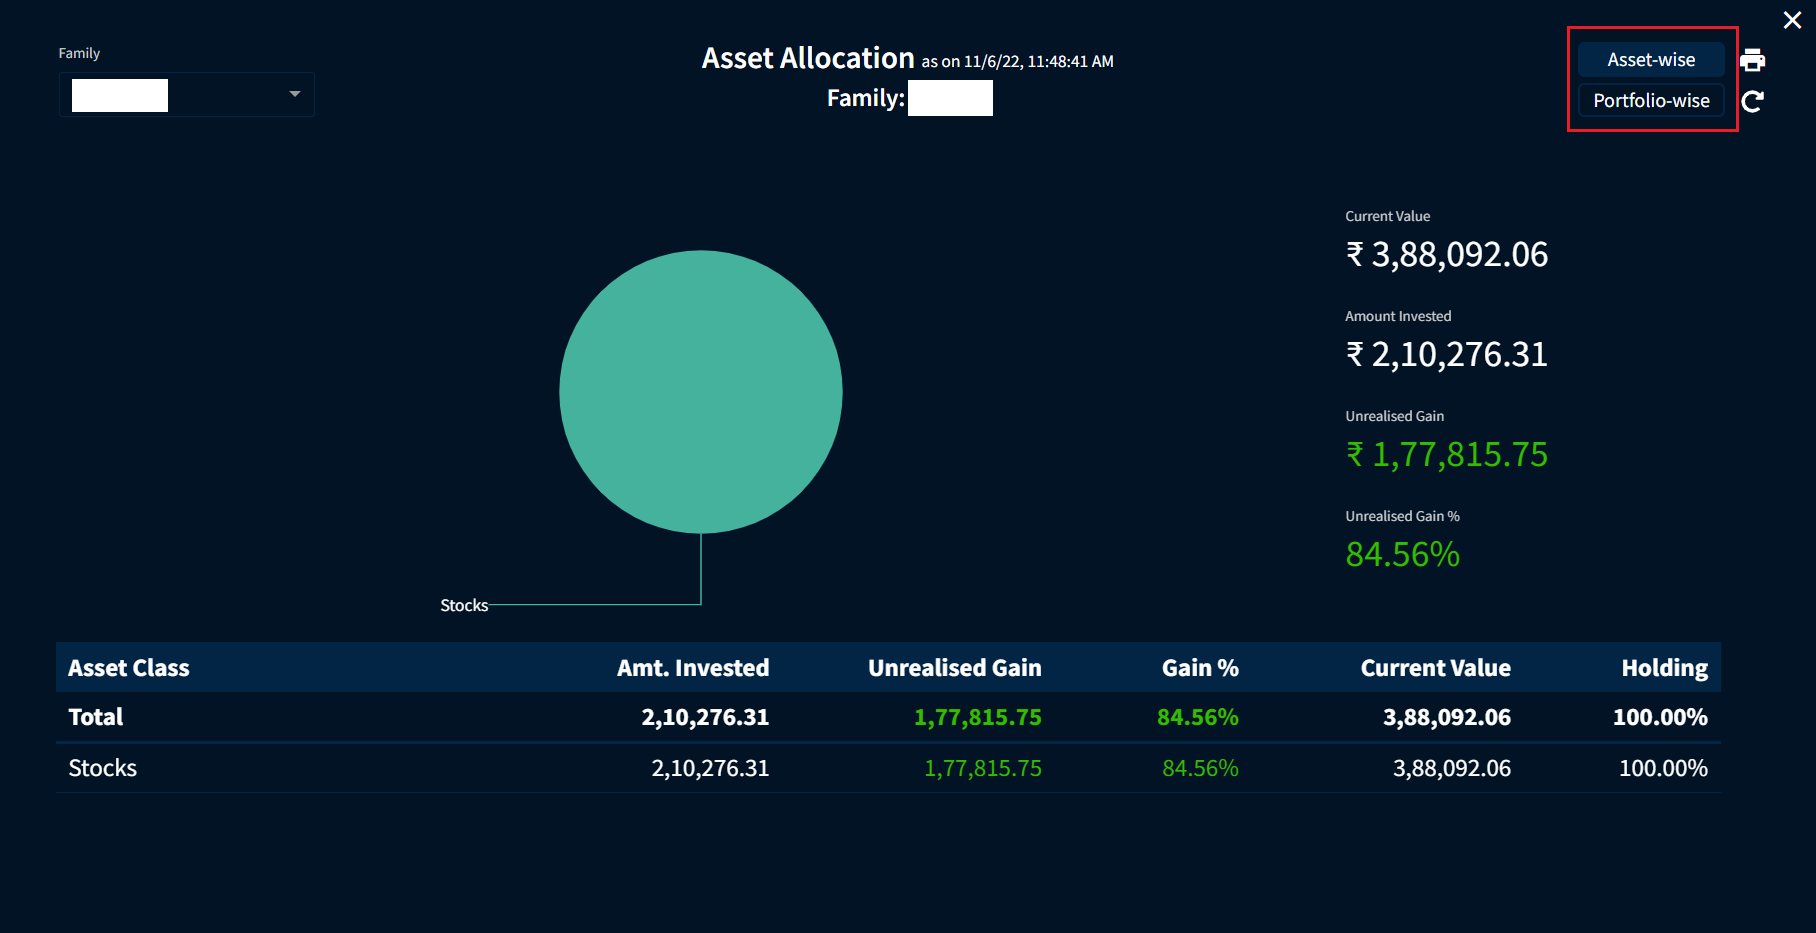
On the top-hand side, you will find a menu titled “Dashboard”(green box below). The dashboardallows you to view your entire portfolio in a consolidated view.
.png)
The dashboard provides you with two options (highlighted in the red box below) to view your portfolio:
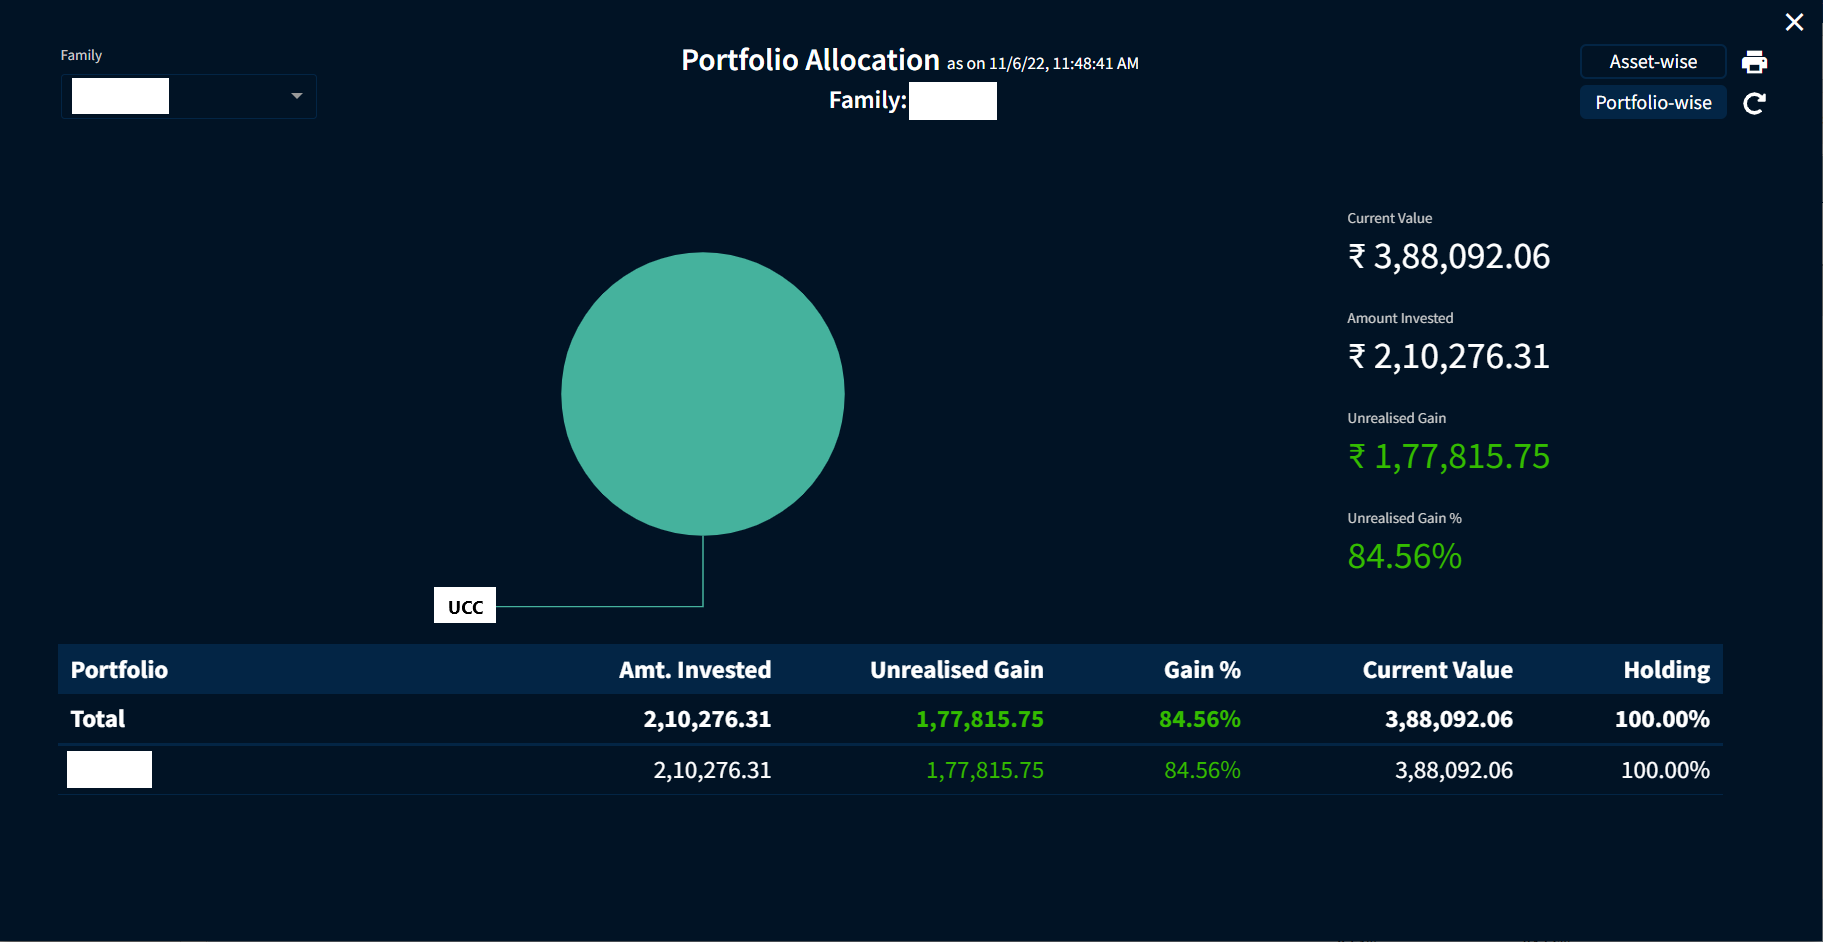
To view all your past transactions in stocks that aren’t present in your current holdings, click on the “Actions” menu in the top-right corner (red box below) and click on “View All Transactions”(circled in green).
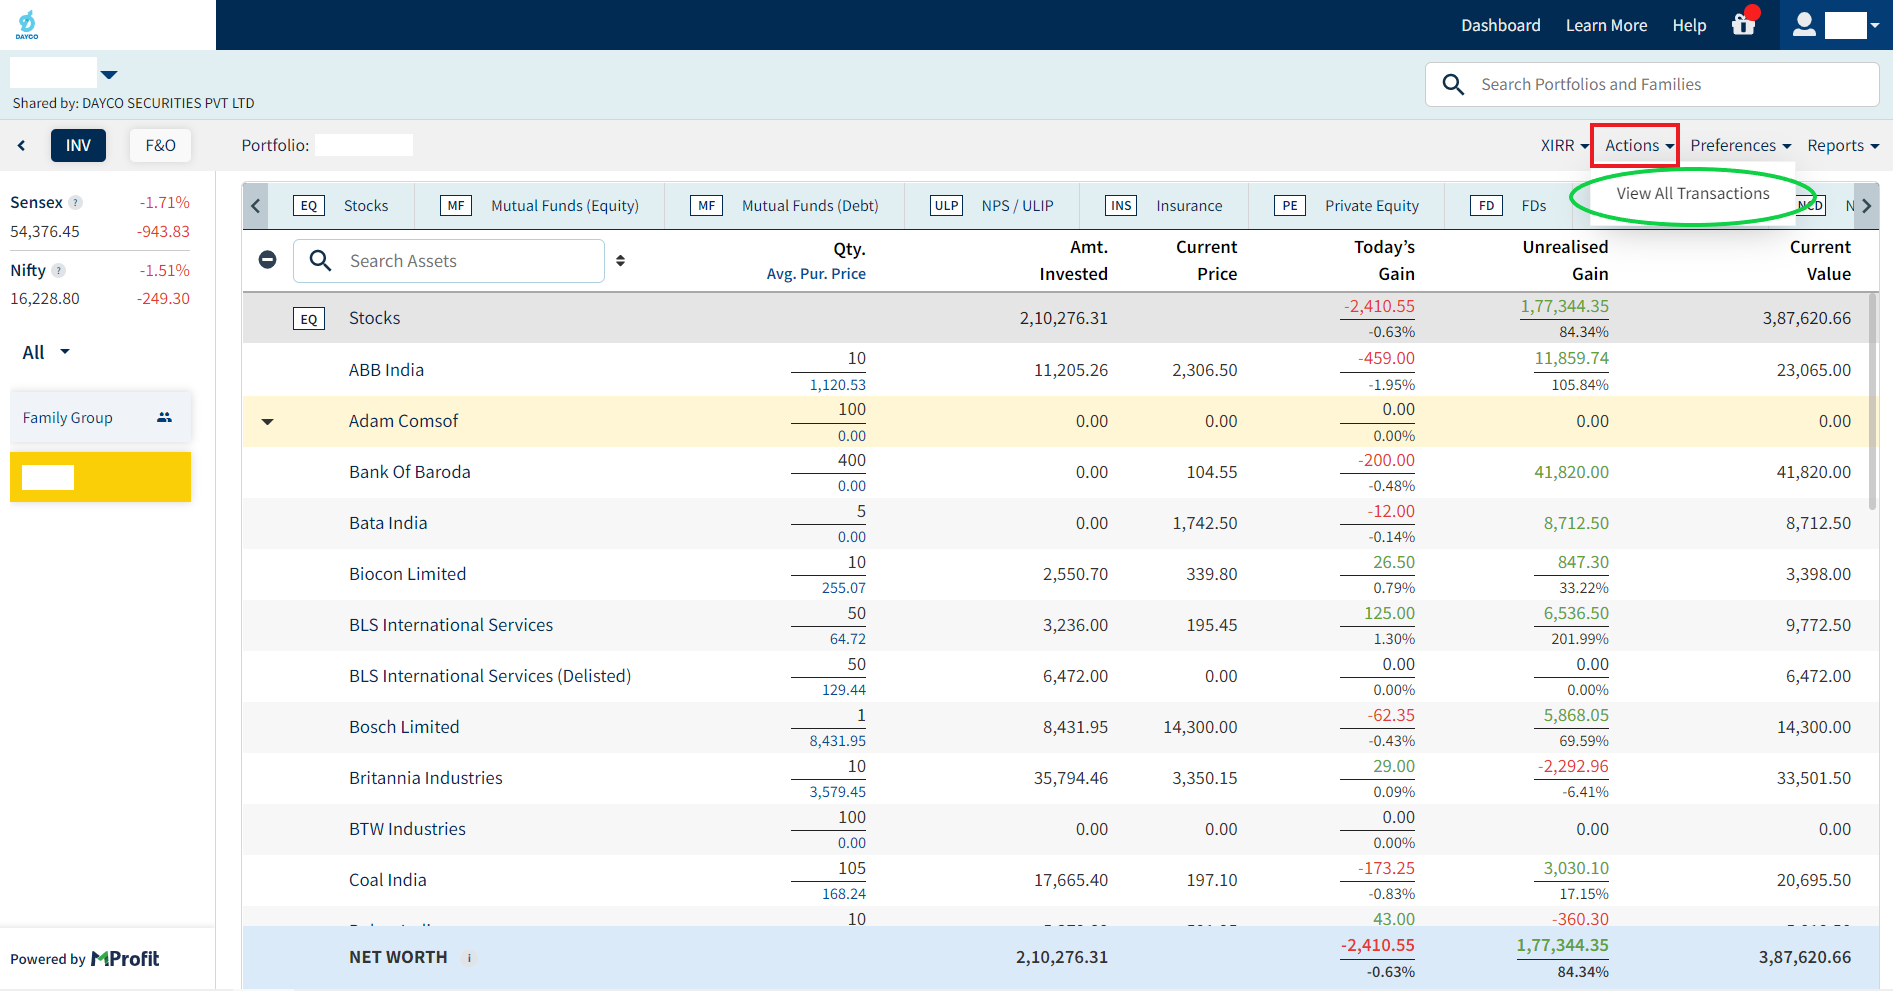
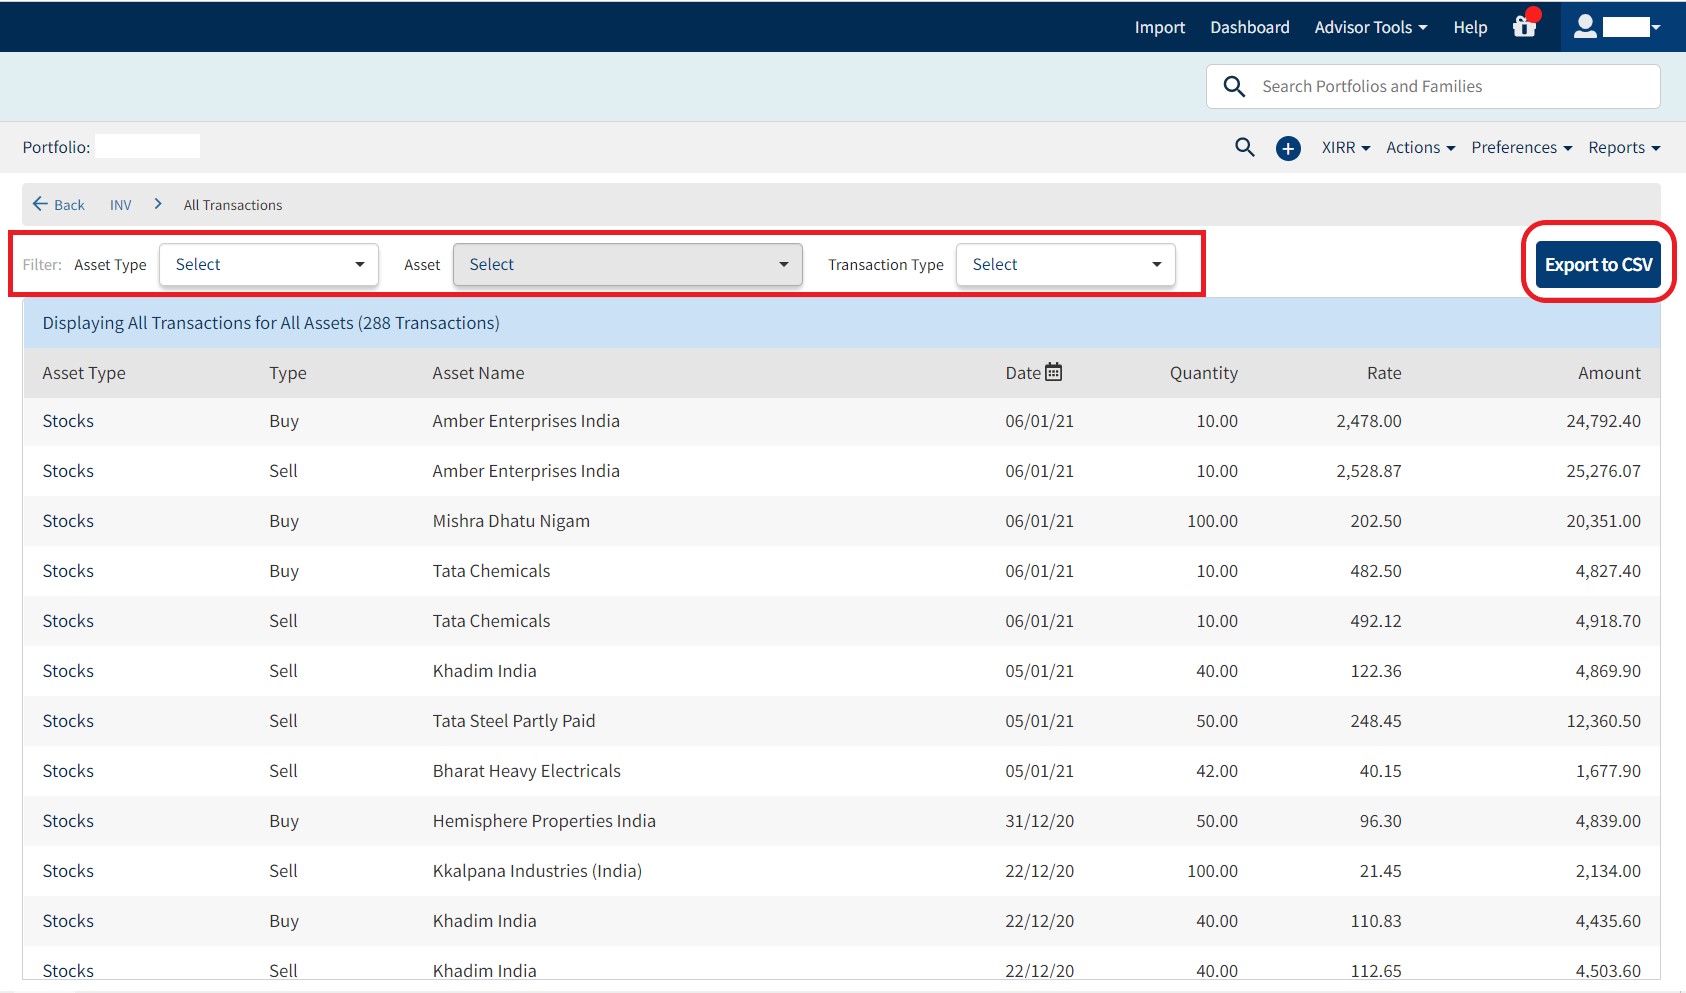
You’ll have the following screen in front of you. At the top left, you’ll find filters where you can select the stock for which you want the transactions and the type of transactions you wish to view. There is also a button at the right end to let you export files in CSV format.
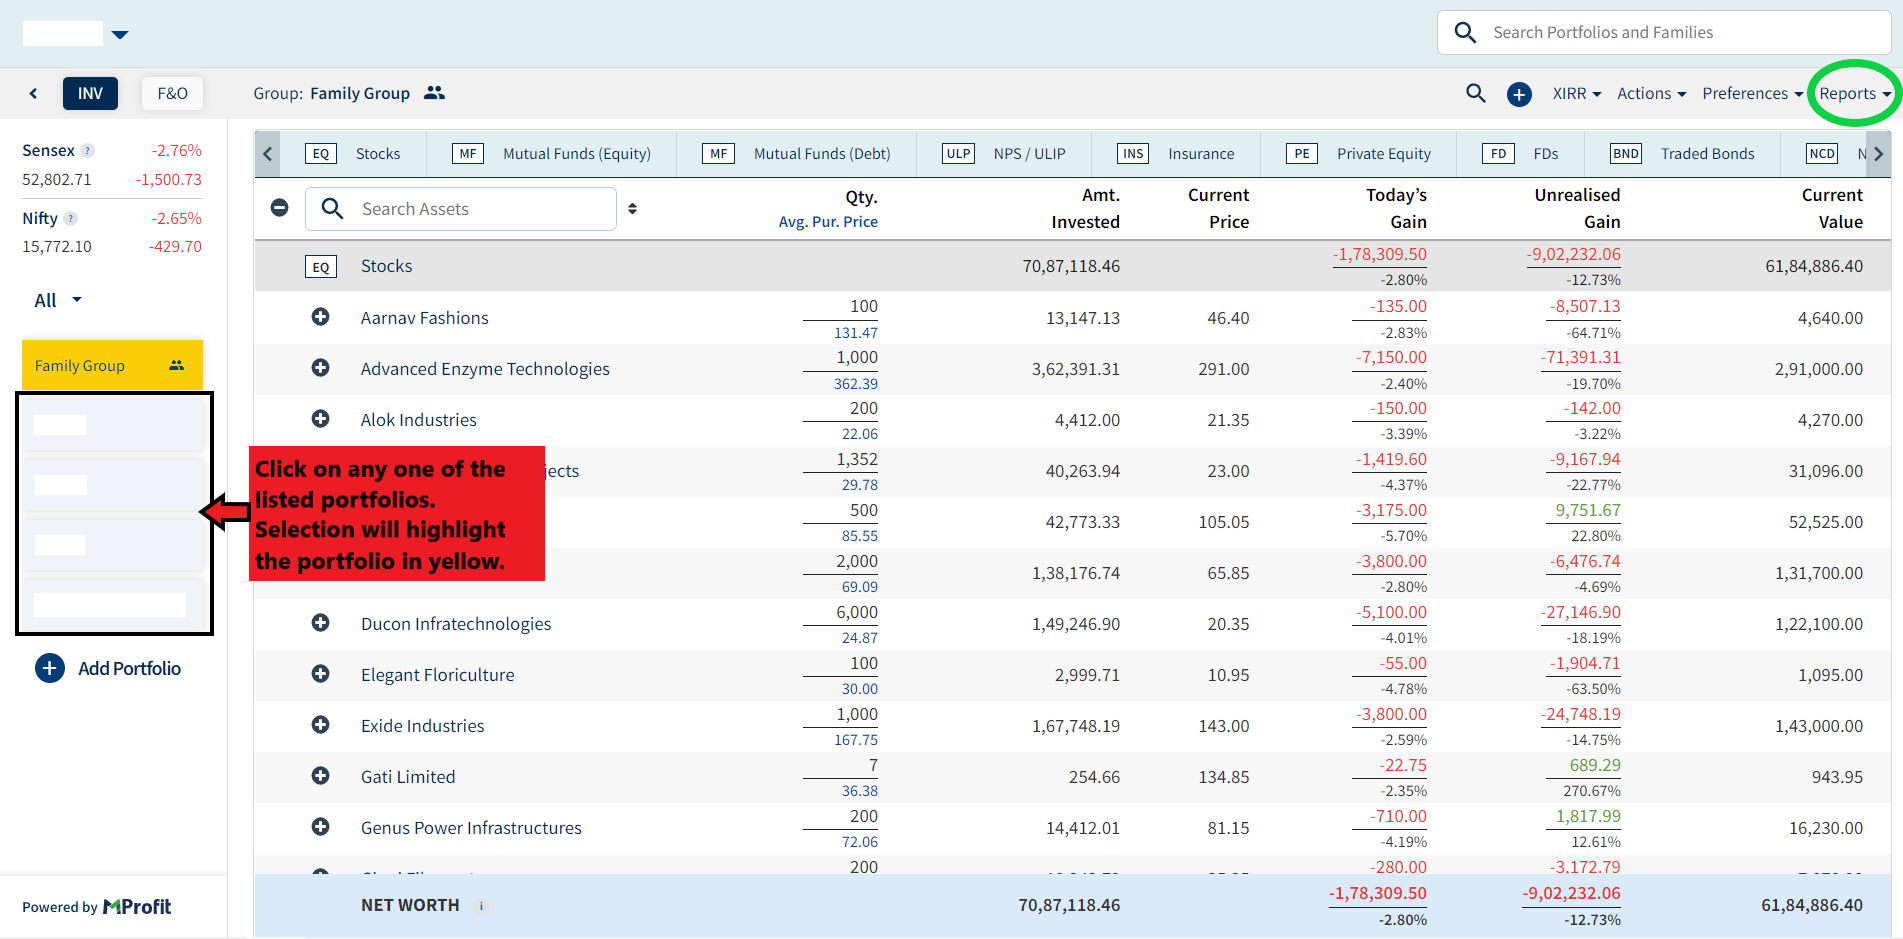
The portfolio summary report lets you get an overview of your active portfolio holdings with current valuations. First, click on the portfolio for which you want the report on the left-hand side under the “Family Group” (black box below) section (Selected UCC/Portfolio will be highlighted in yellow)and enter the report section by clicking on the top-rightmenu titled “Reports”(circled in green).
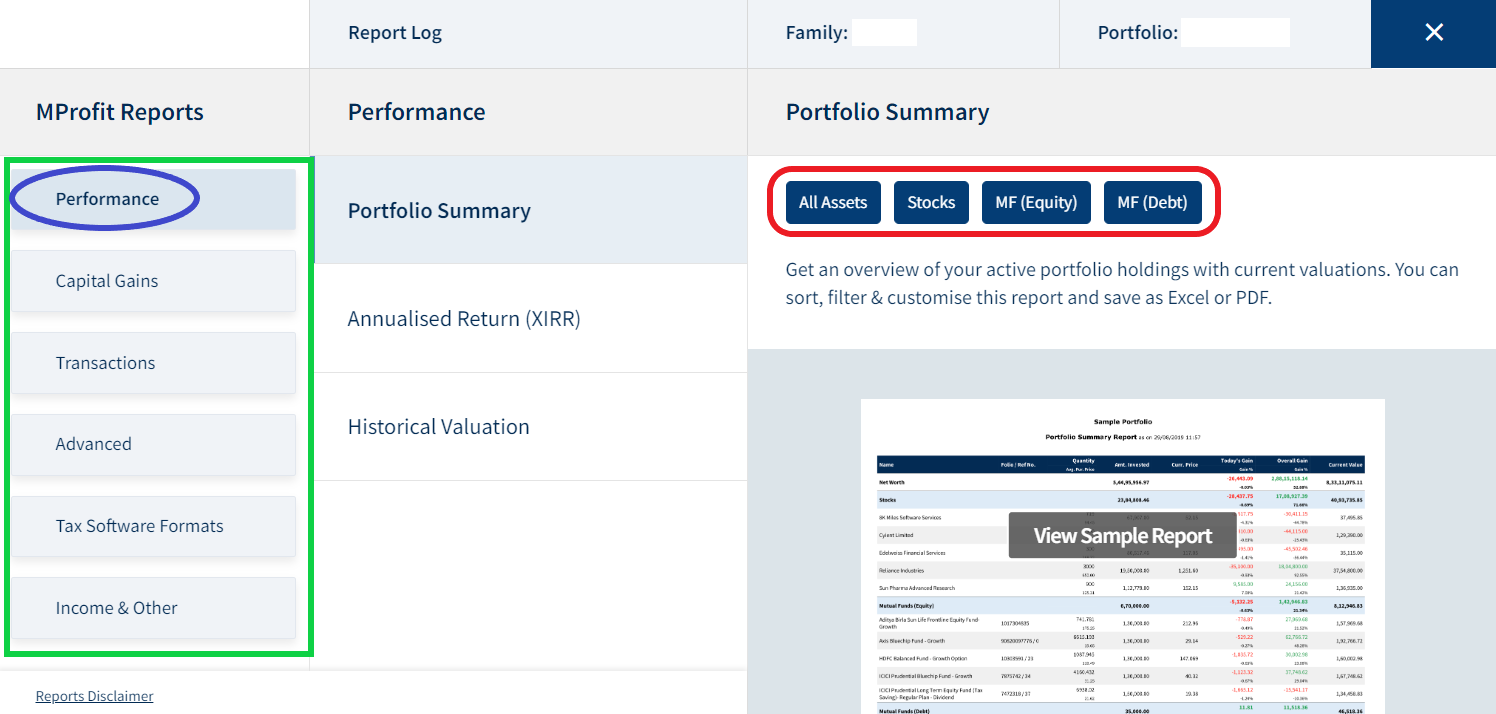
You’ll have the following screen in front of you.You can see all the different reports available in the portfolio tracker on the left-hand side (green box below).Click on the “Performance” tab and then “Portfolio Summary”. You’ll see an option to select the asset type(red box below).
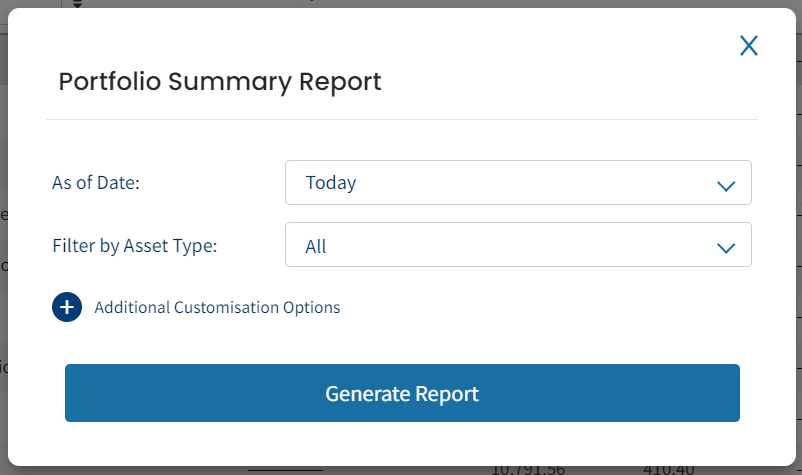
You will see the following screen after clicking on one of the asset-type options. You can select the period you want the report for and the asset type from the drop-downs provided.
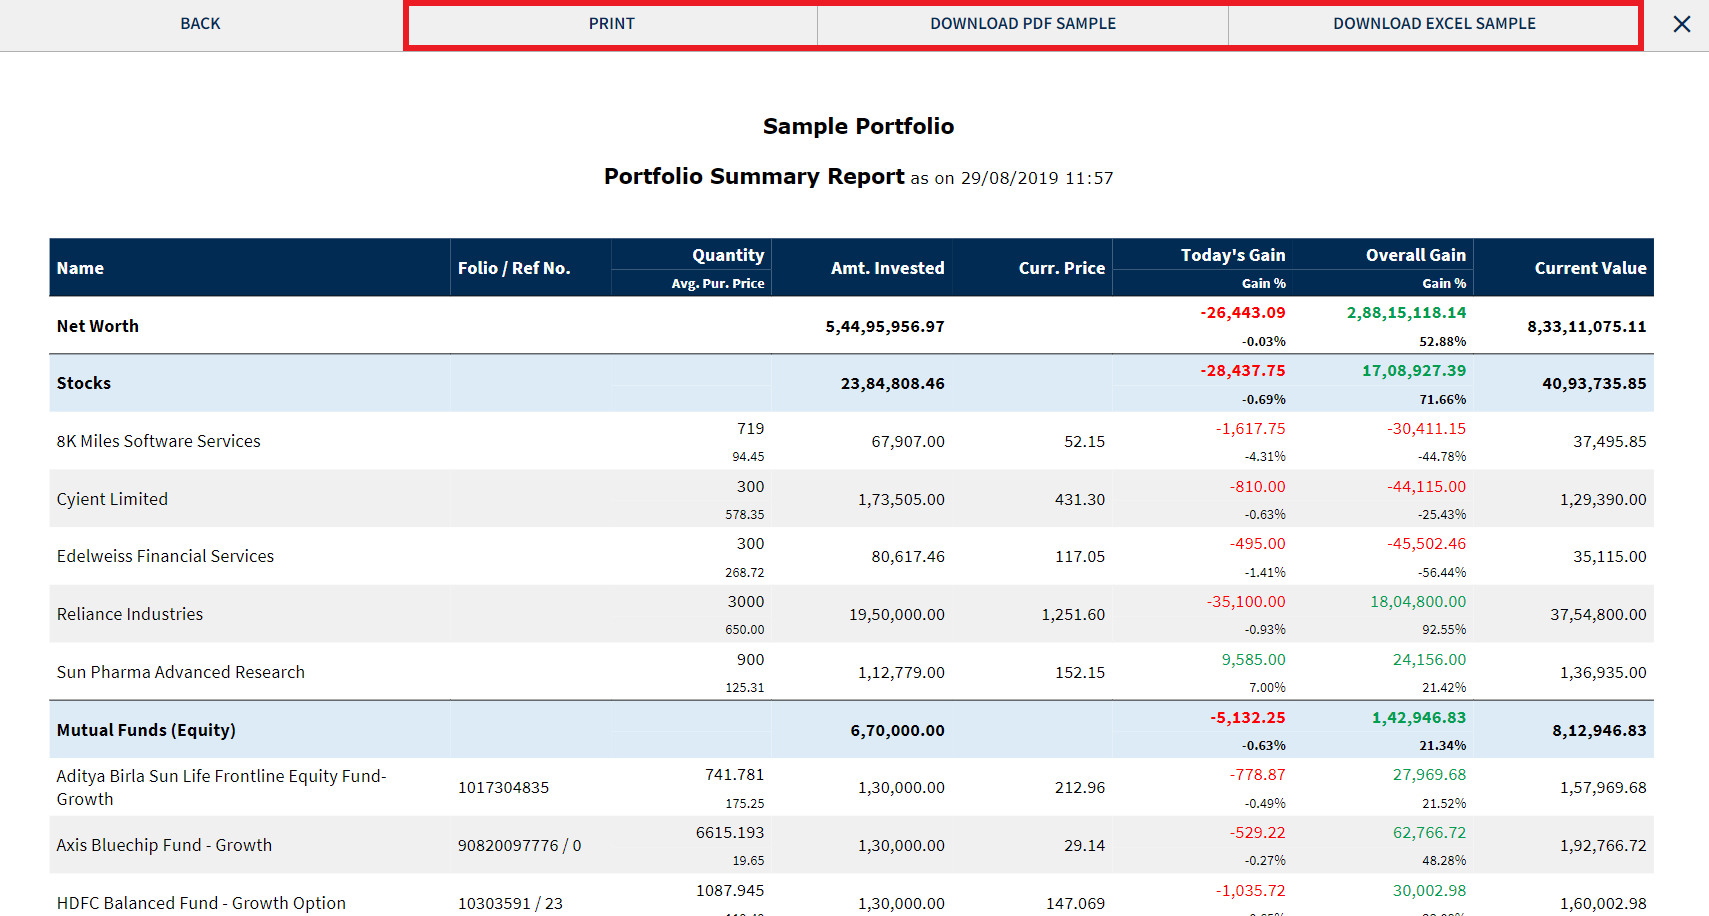
On clicking “Generate Report”, please wait for a few moments to let the system process and generate the report. Once the report is generated(Sample report below), you’ll find options toprint and download the report in excel or PDF.
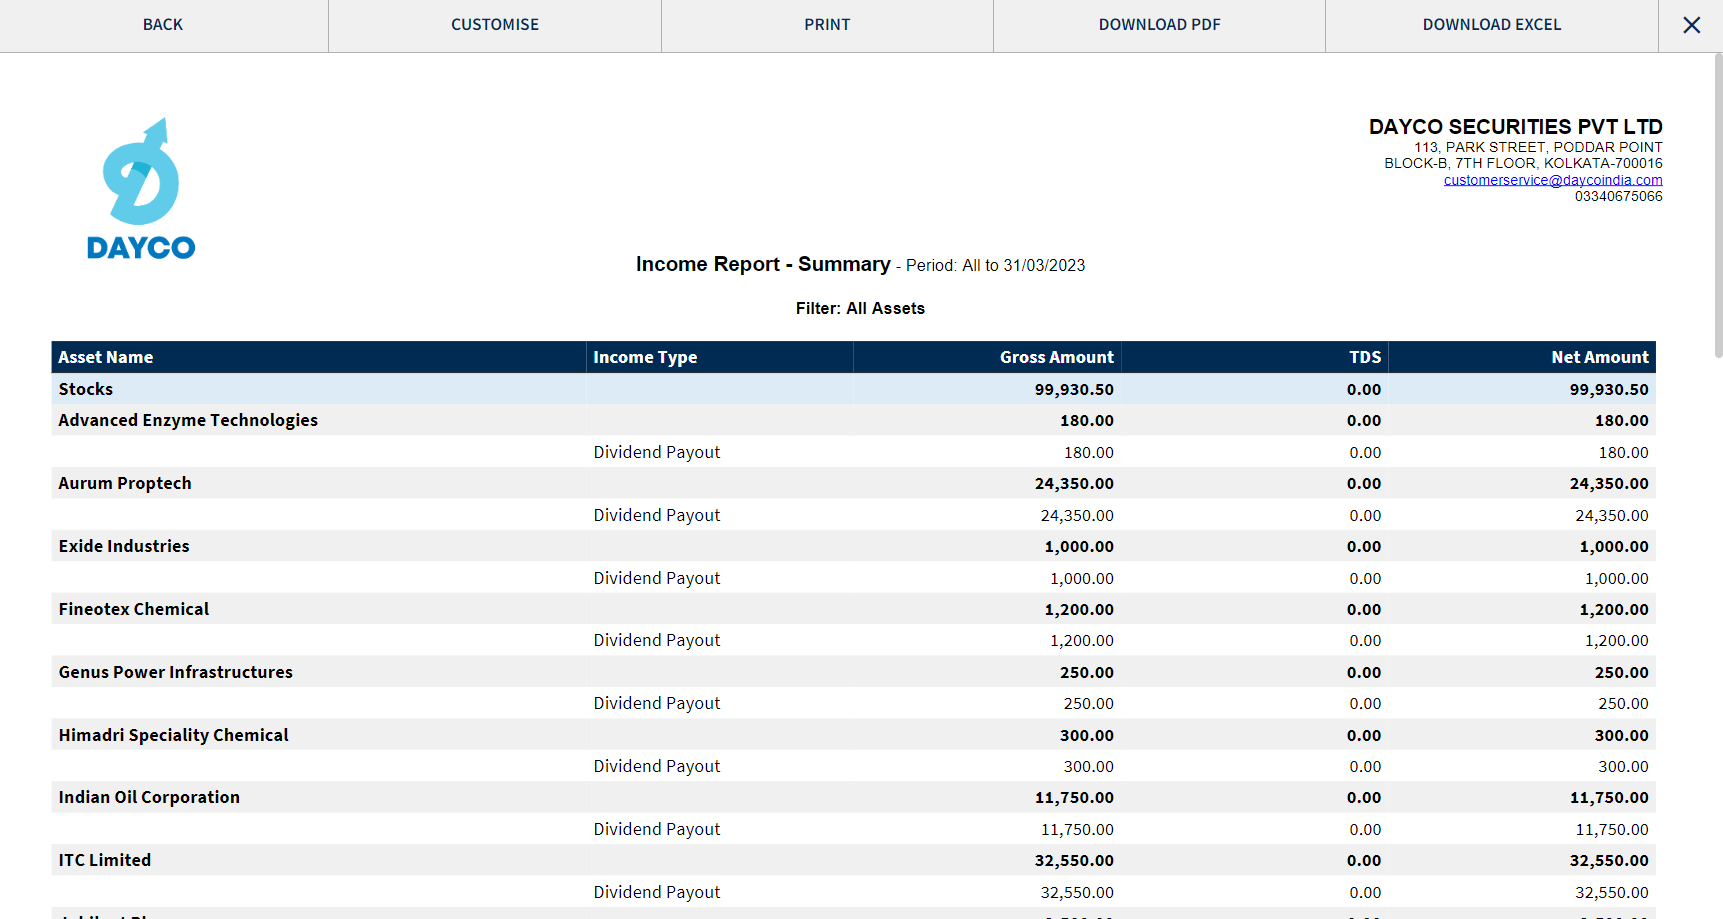
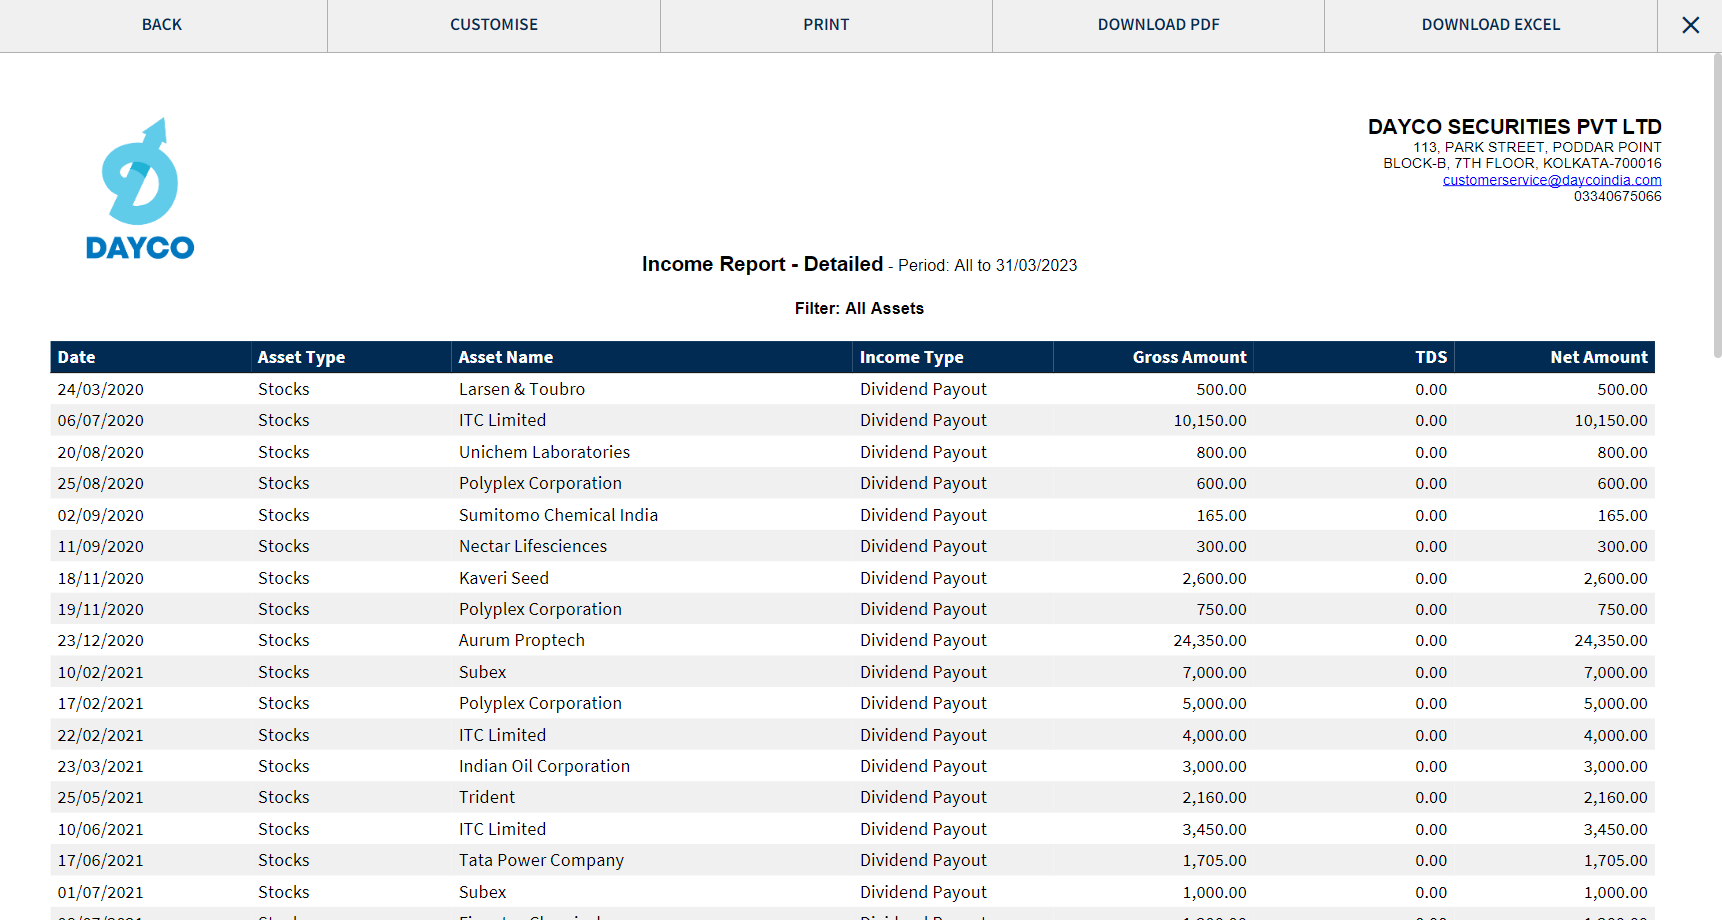
The income report lets you get an overview of your dividend, interest & other income across all asset categories. You can either take anincome report for a single asset (for instance, stocks) or a consolidated report for all assets across a specific time period. You can view the income report for a particular FY, last FY, current FY, for a specific month, or all to date and also set up your custom range.
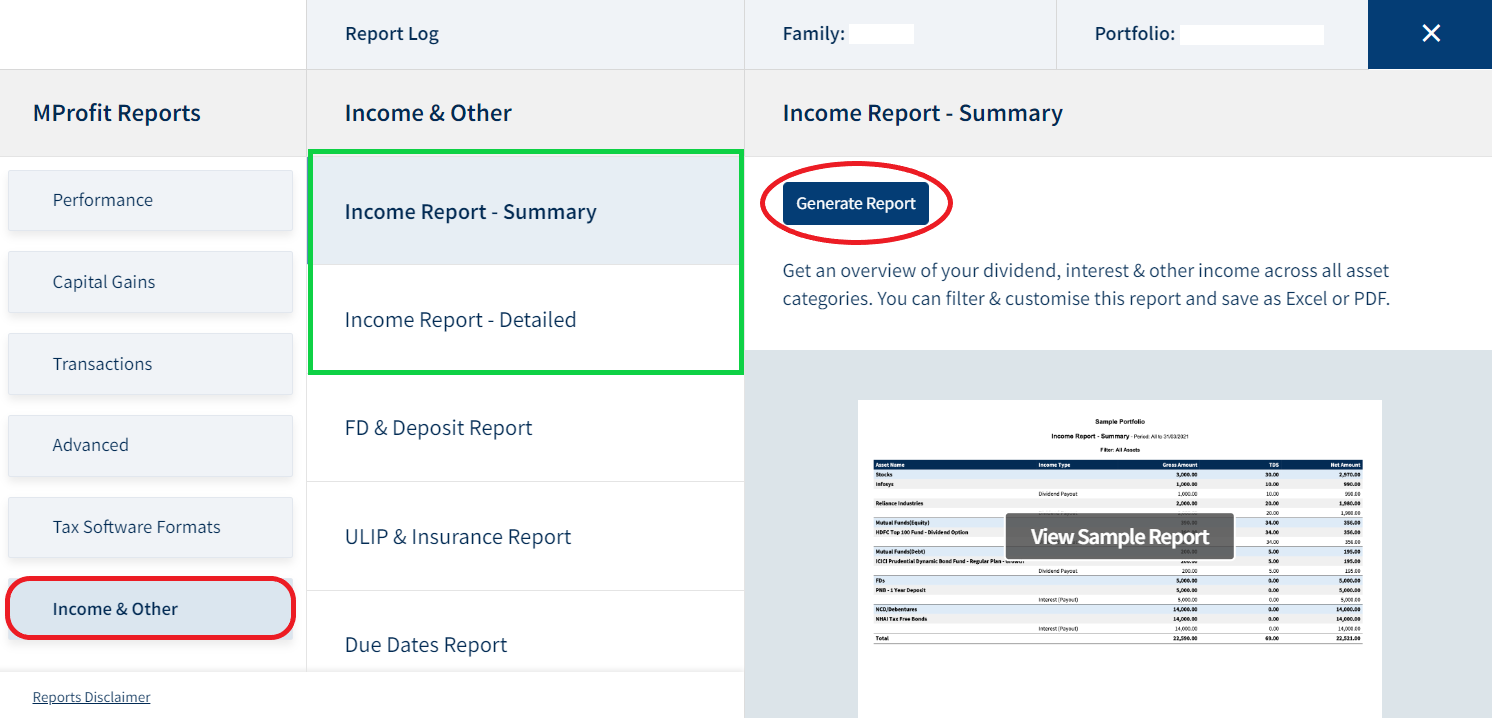
In the “Reports” section, click on the section titled “Income & Other” and proceed to “Income Report – Summary” or “Income Report – Detailed” (Marked in green). Click on the “Generate Report” button, put in the asset and period you want the report for,and wait for the system to process your request. Upon report generation, you can download or print the report.
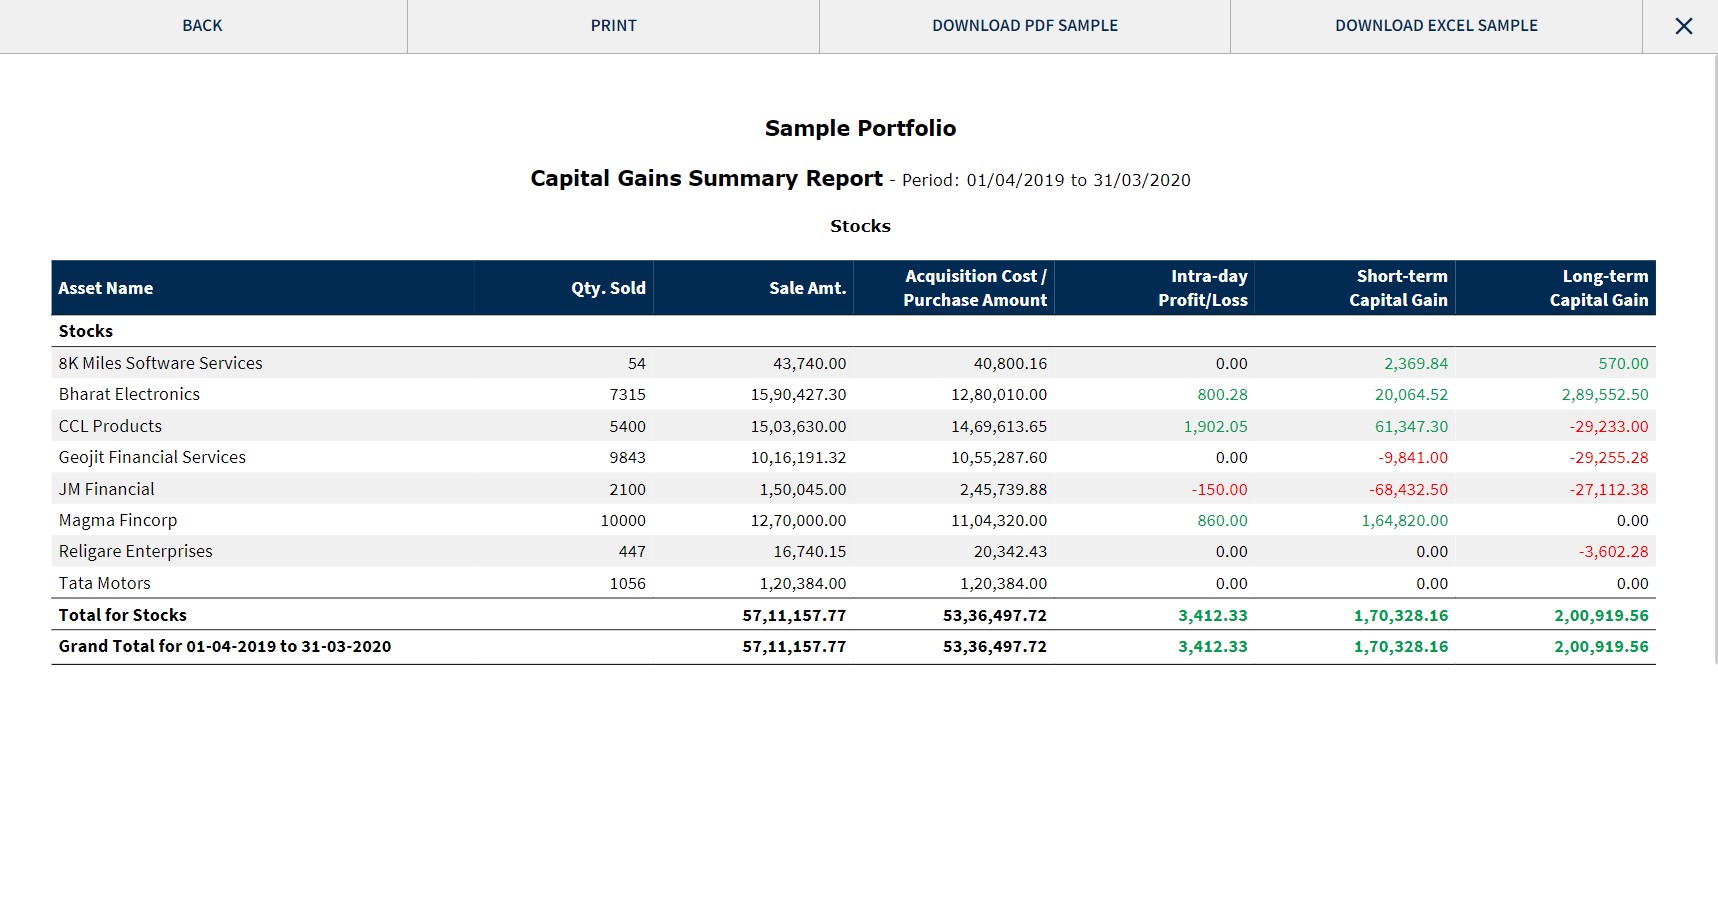
Click on the section titled “Capital Gains”(red box below) in the report section to generate a capital gains report.
The Capital Gains report section helps you generate five different types of reports.
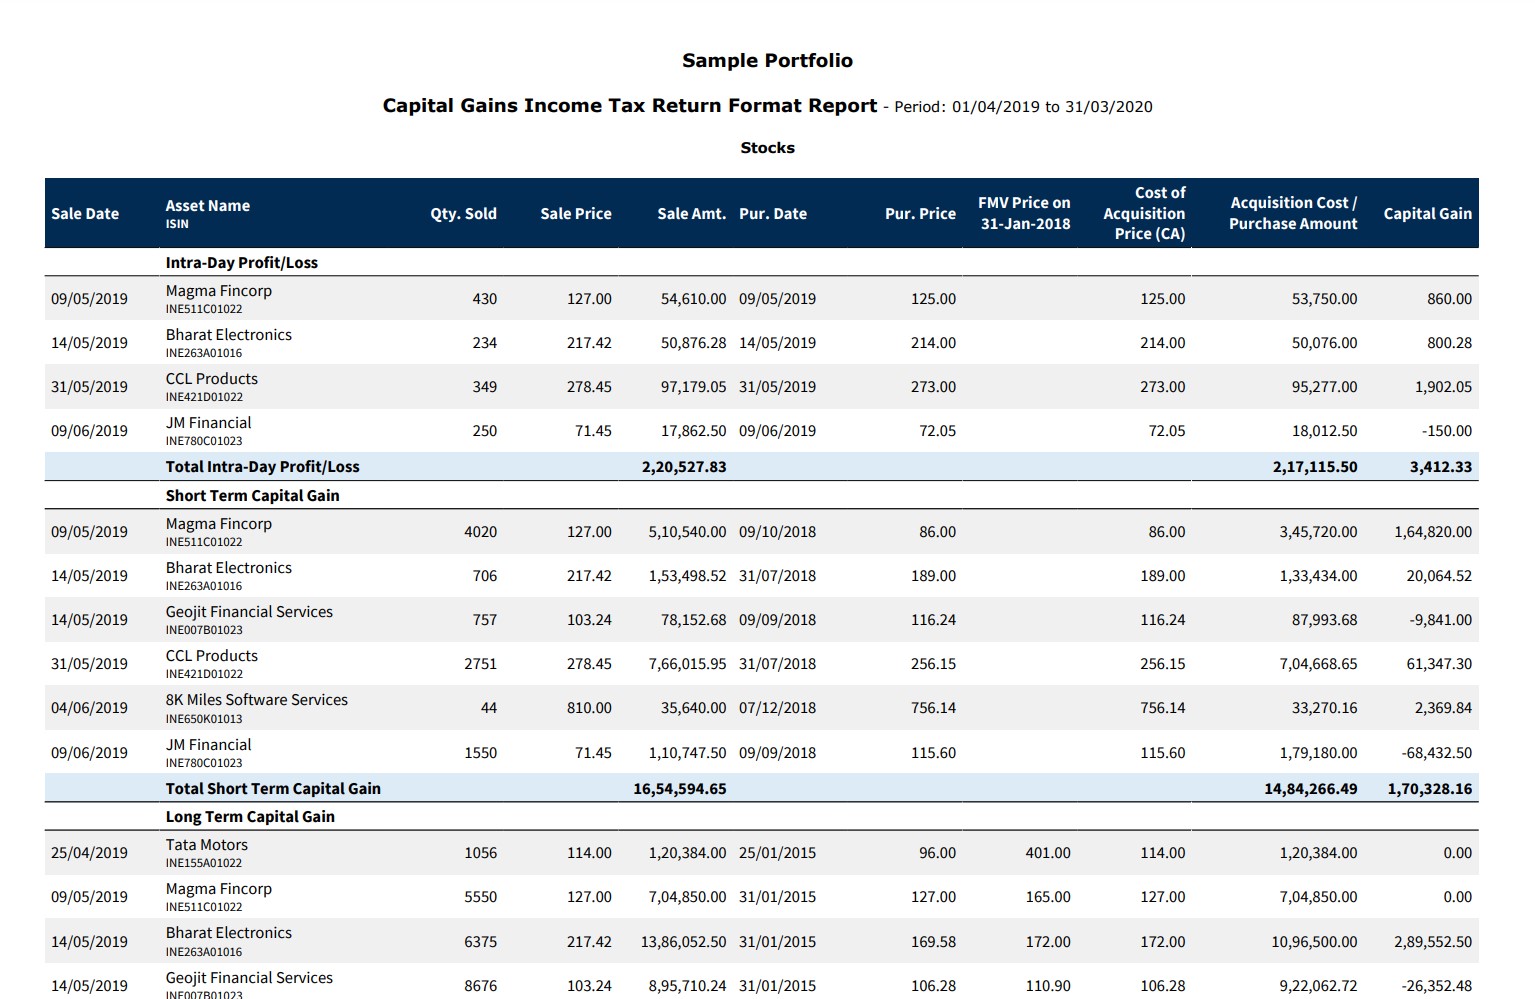
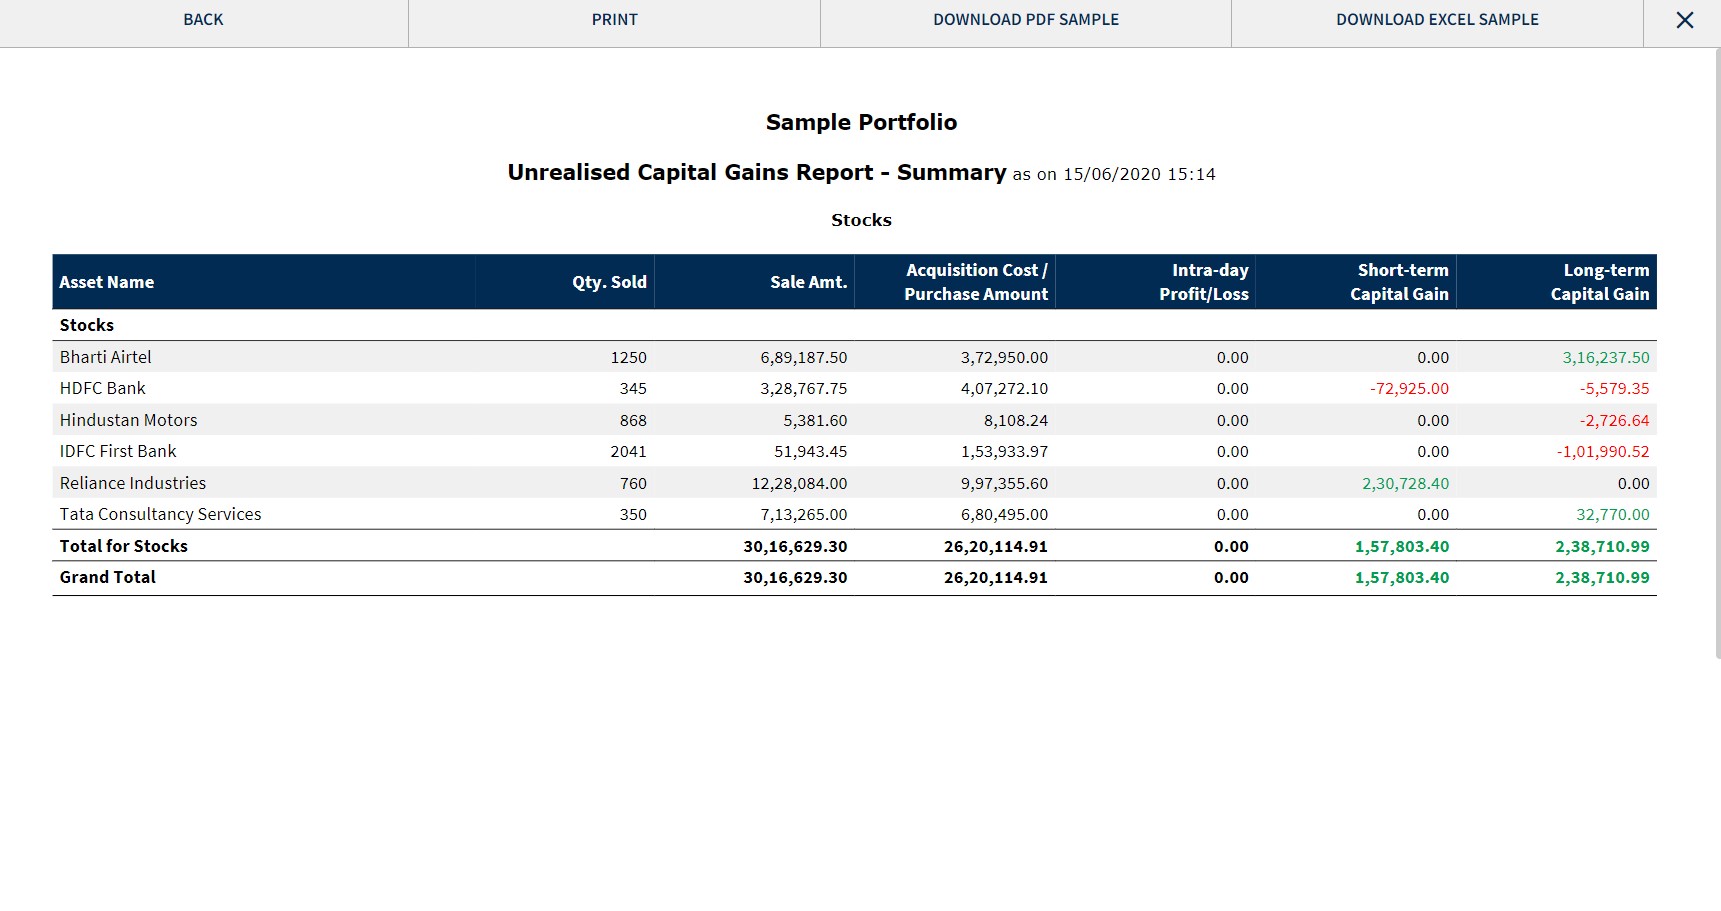
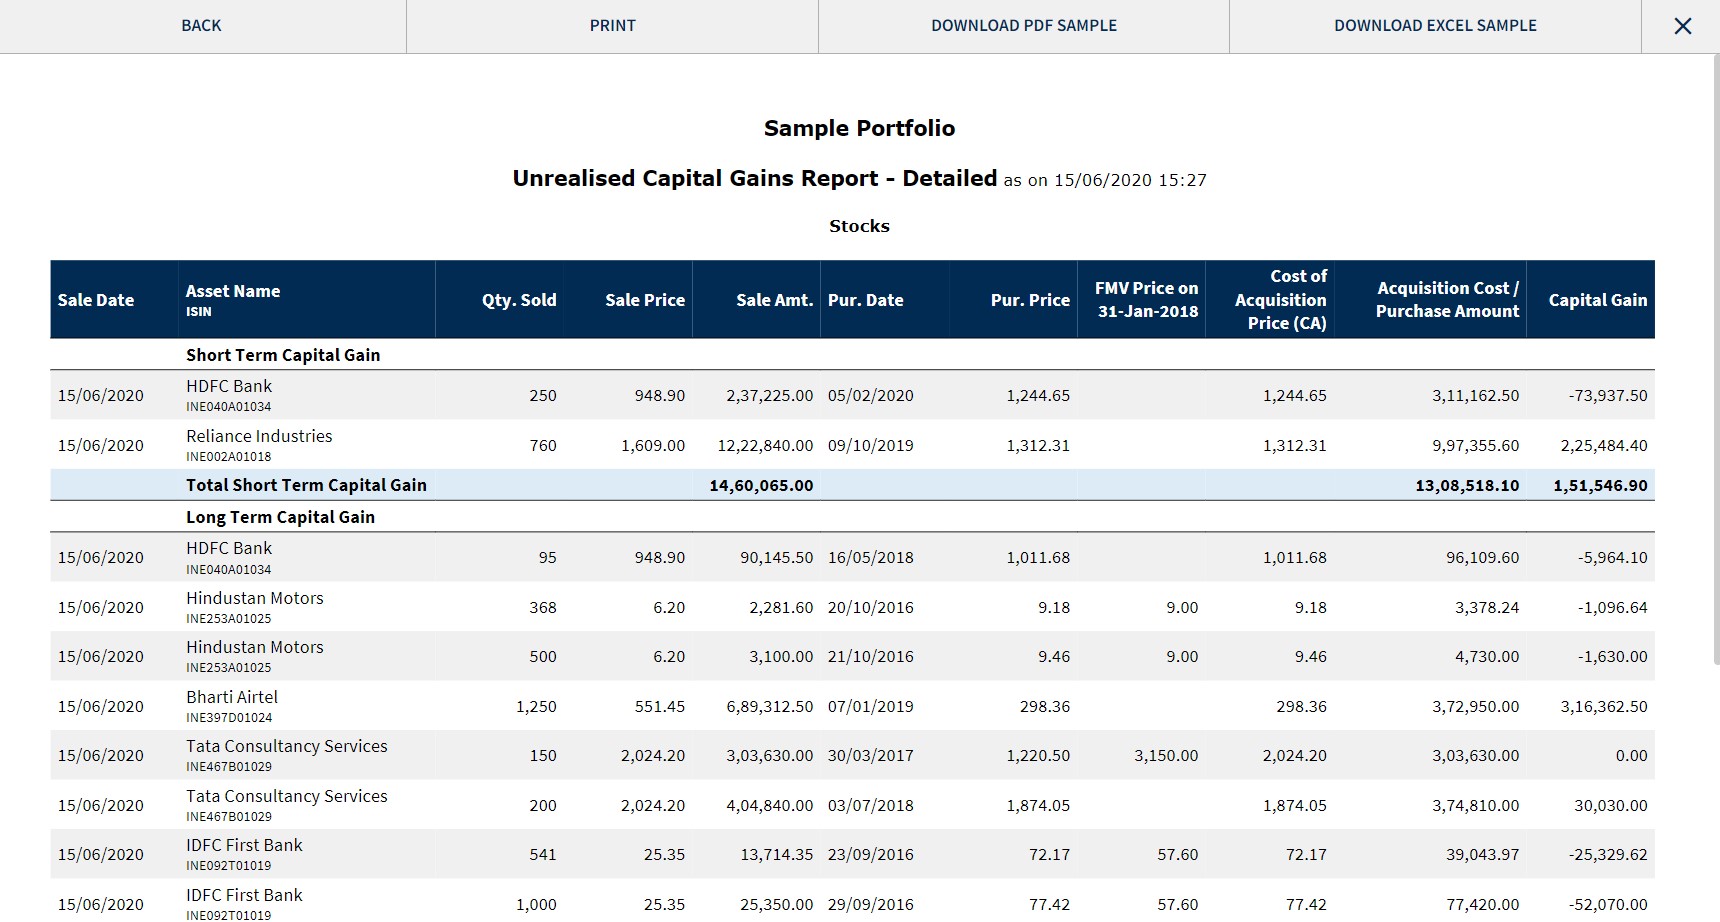
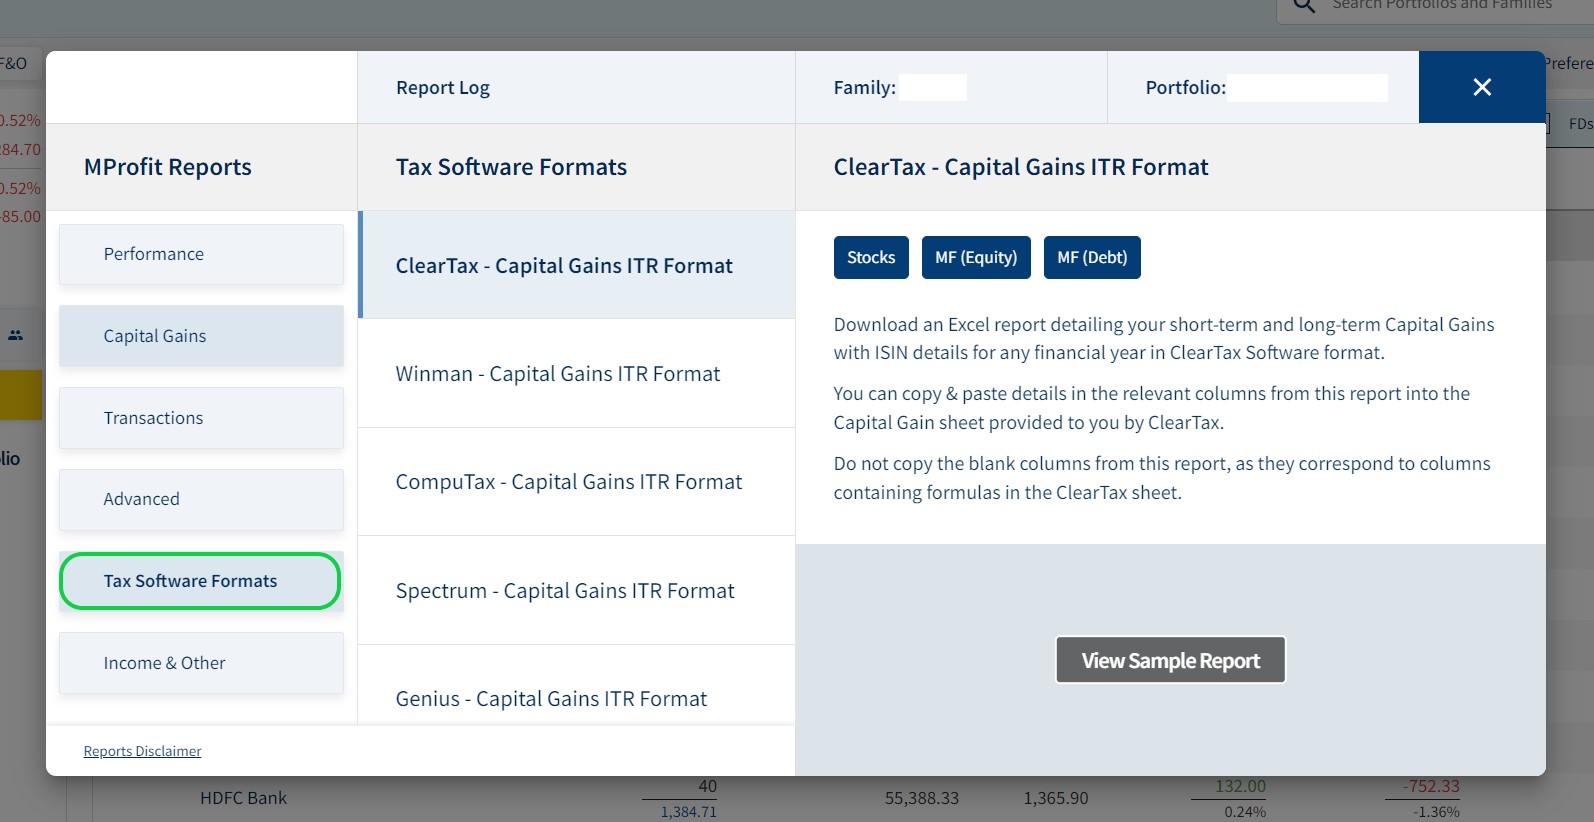
If you are using a tax filing software like ClearTax, Winman, CompuTax, Spectrum, Genius or Taxpro, you can navigate to the “Tax Software Formats” tab(green box below).This section helps you generate reports per the tax filing software format mentioned above. You can copy & paste details in the relevant columns from these reports into the Capital Gain sheet provided to you by the tax filing software. These reports are available in excel formats.
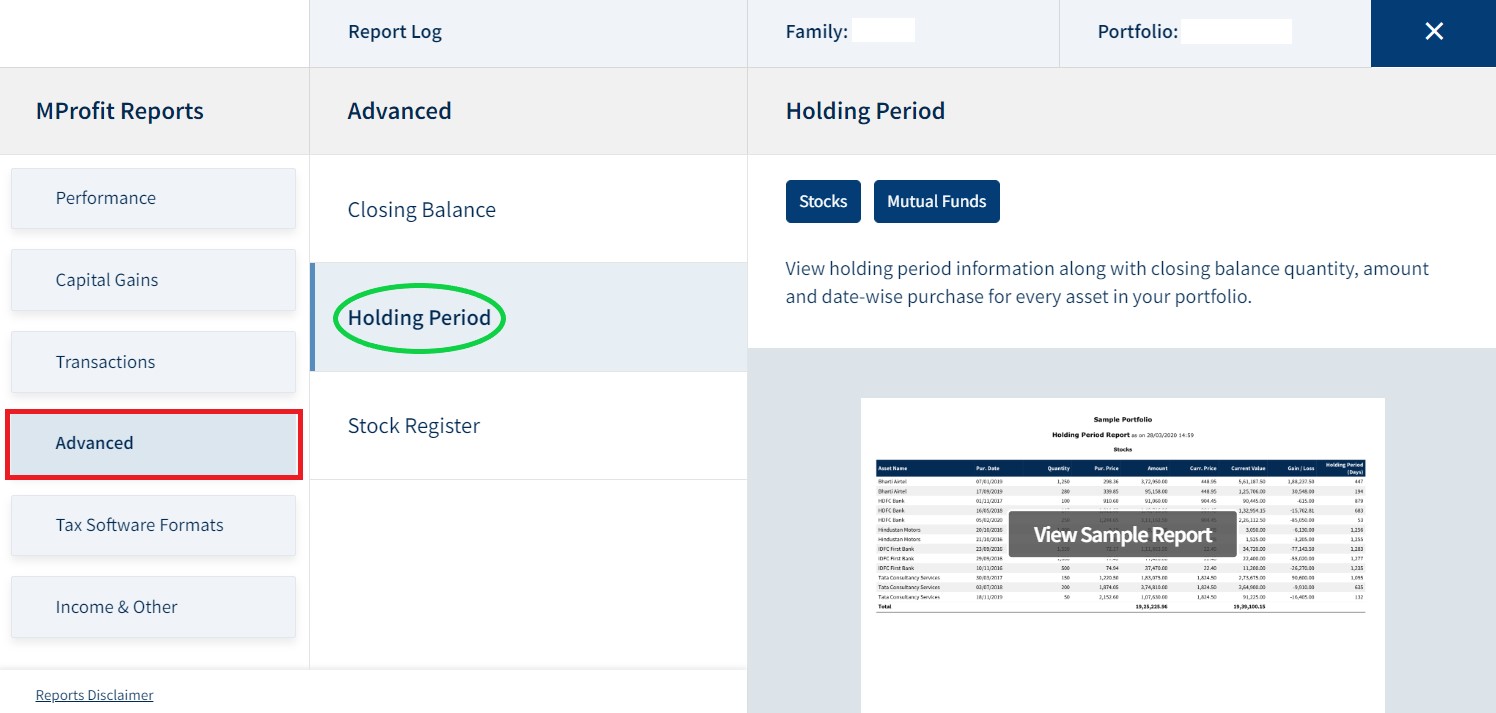
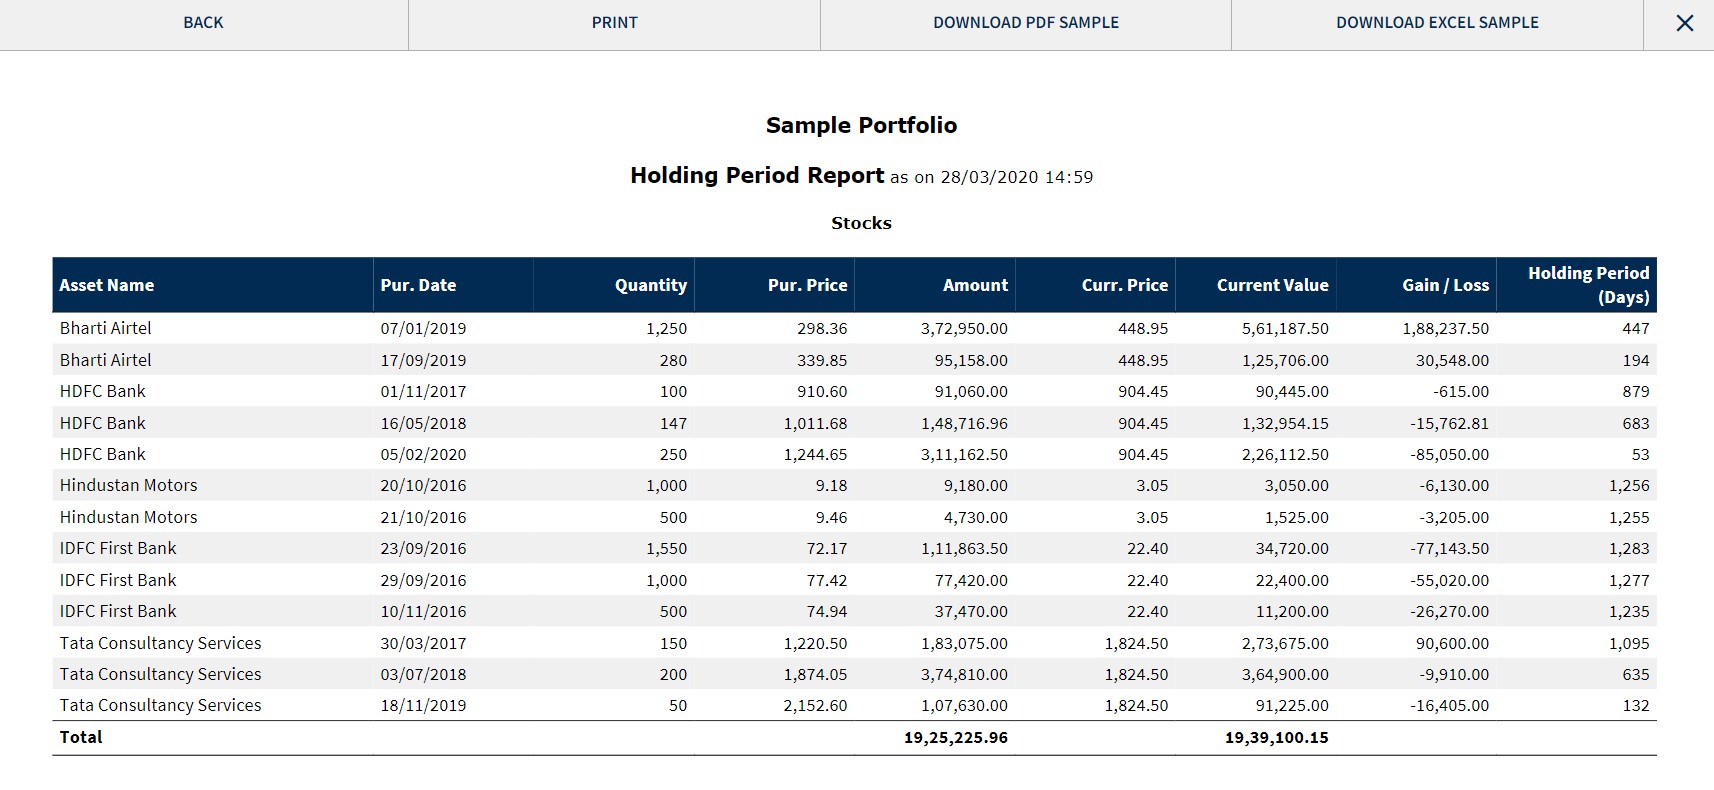
This report helps you view holding period information and closing balance quantity, amount and date-wise purchase for every asset in your portfolio.The holding period decides which assets are long-term and short-term in the portfolio. You can generate this report under the “Advanced” tab in the report section.
The “Transactions” tab in the report section lets you generate contract note reports and transactionreports for all assets.
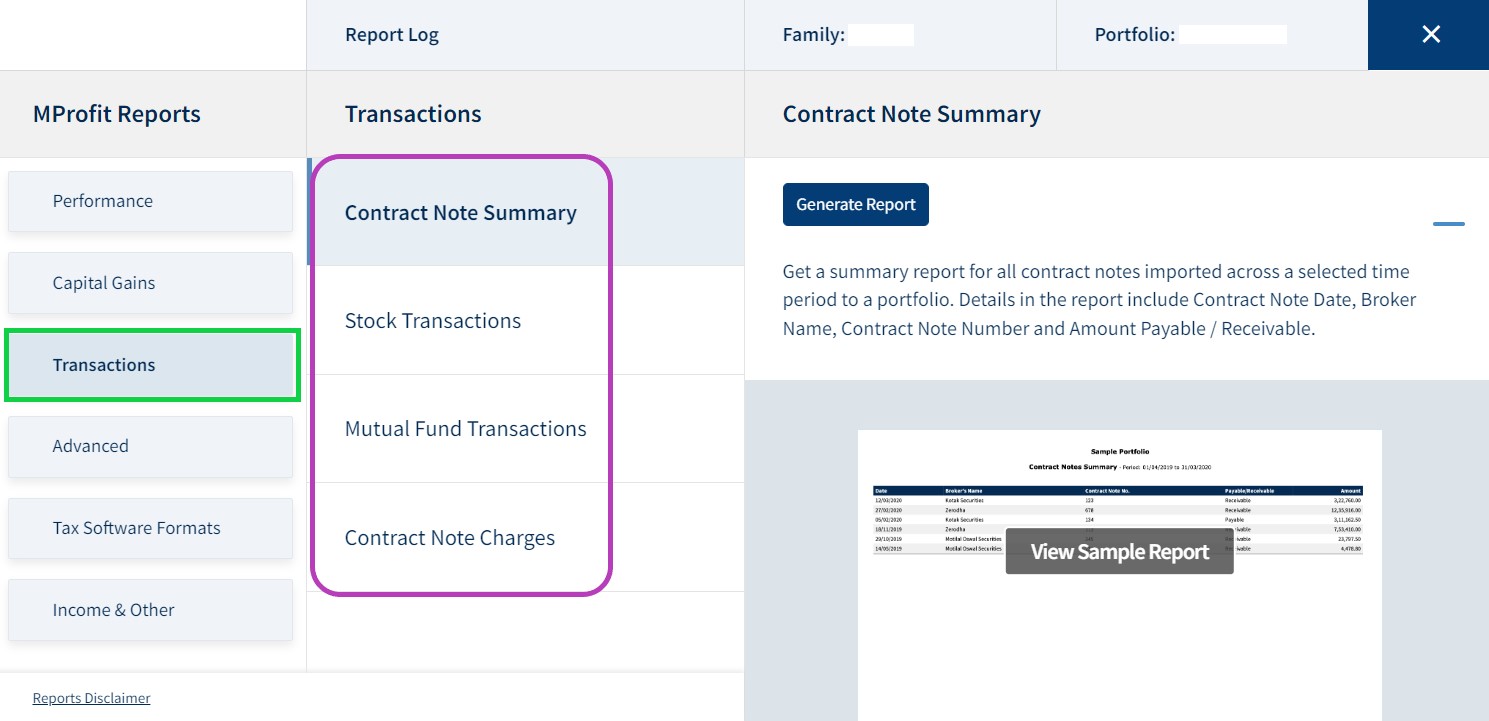
Contract Note Summary Report: Get a report detailing the Amount Payable/Receivable across a selected time frame segregated by contract note numbers.
Stock/Mutual Fund Transaction Reports: Get a report detailing all your Stock & Mutual Fund transactions across a selected time period in a portfolio. For each stock transaction in the report, view the Date, Quantity, Price, Brokerage and Amount.For each mutual fund transaction in the report, view Date, Quantity, Price, Gross Amount, STT, Stamp Charges, TDS and Net Amount.
Contract Note Charges Report: Get a report detailing your stock contract note charges across a selected time period in a portfolio. For each contract note in the chosen time period - view STT, GST, Stamp Charges, Transaction Charges and Other Charges. This report is only available in excel format.
I'm a cool paragraph that lives inside of an even cooler modal. Wins!
In case you didn’t know, you can open your account online within 24 hours. Offline account opening takes up to 4 working days. If you wish to open your account offline, fill and sign the forms using a black/blue ballpoint pen. Please fill in the email and mobile number of the applicant to avoid account opening delays.